The
Deployment GapVibe Coding 2026
What Greta.sh's own product data reveals about how people build software when they describe it instead of writing it — and how much of it actually ships. Six months of platform telemetry, reported as rates and shares.
Executive Summary
Between February 5 and August 5, 2026, builders on Greta.sh kept up a steady pace of new app creation, deployment, and global reach. Looking back further, Greta.sh's full operating history shows an average of a little over 3.4 apps built for every account ever opened — evidence that "vibe coding," building software by describing it in plain language rather than writing it line by line, has moved well past its novelty phase.
This report is built entirely from Greta.sh's own product data: every app created, every deployment, and the geography of who actually opens these apps once they're live. It is not a market-wide survey — it is a close look at what happened on one product, at meaningful scale, across a continuous six-month window. Four findings anchor the rest of this report.

Vibe coding, illustrated: building software by describing it, not typing every line of it.

The prompt is the new keyboard shortcut — most Greta.sh builds start as a sentence, not a blank file.
~39% lifetime deploy rate
Across Greta.sh's full operating history, roughly 4 in 10 apps ever built have reached a live, publicly accessible URL. Cohorts from this six-month window sit near ~34% — lower mainly because they've had months, not years, to ship, not because builder behavior has changed.
- Roughly one in three apps ships within the window — closer to four in ten over the platform's full history. Deployment held between 27% and 38% every month of the six-month window (34% overall). Cohorts given years rather than months to mature land closer to ~39%. Both numbers describe the same behavior at different stages of maturity — the gap between them is time, not a change in builder intent. See Section 3.
- AI/ML novelty apps are the biggest single category — and the most viral. Gesture-recognition and vision-filter apps built for hobbyist and fandom communities produced some of the single highest build counts anywhere in the dataset.
- Task management is the default first build — and, grouped, the largest category overall. Todo lists, note apps, and CRMs are what almost everyone builds early on — the "hello world" of vibe coding. Taken together as one function, task, project, and todo tools account for ~21% of categorized apps, ahead of AI/ML at ~16%.
- Vibe coding reaches well beyond wherever its builders sit. Greta.sh's deployed apps were opened from well over 100 countries in a three-week visitor sample, after bot and datacenter traffic was excluded, with meaningful volume well outside the usual US/Western-Europe center of gravity — India, the Philippines, and Southeast Asia show up clearly in the data.
Methodology & Data Notes
All figures in this report come directly from Greta.sh's own product analytics for the window February 5 – August 5, 2026 (six months), unless otherwise noted. A few definitions matter for reading the numbers correctly:
- One platform, one continuous history. Greta.sh was previously available at greta.questera.ai; that platform was later moved to its current home, greta.sh. This report treats data across that transition as a single, continuous Greta.sh dataset, and does not distinguish between the two anywhere else in this report.
- Percentages, not totals. Per internal policy, this report expresses activity in relative terms only — percentage shares, rates, and ratios — rather than as absolute counts of apps, accounts, or events, and does not report period-over-period change in Greta.sh's own activity, since that would only be meaningful measured against comparable data from other platforms. Sample sizes underlying each analysis are not published externally, in keeping with this same policy.
- Cohort maturation. An app's deploy status is measured as of the report date, so a cohort from February has had six months to ship and a cohort from July has had one. Recent months are therefore right-censored and systematically understate their eventual rate. Section 3 separates cohorts with at least 90 days to ship from those still maturing.
- Apps created counts every app record made, including ones later deleted by their builder — the goal is to measure everything attempted, not just what survived. Template instantiations count as app creations, so opening a marketplace template and abandoning it appears in the denominator. Internal, staff, test, and demo accounts are excluded throughout.
- Deployed means the app was published to a live, publicly reachable URL at some point. It is deliberately a low bar: it does not mean the app has users, revenue, a custom domain, or a passing security review. It means the builder finished the thing enough to put it somewhere real.
- Category shares (Section 4) come from a random sample of apps created within the window, drawn from all apps created — deployed and undeployed alike — so the category picture and the funnel describe the same population. Each app was assigned one primary function; apps spanning two functions were assigned to the dominant one.
- Visitor geography reflects real page-load events on already-deployed Greta.sh apps — i.e., where an app's audience is, not where its builder is. Known bots, crawlers, uptime monitors, and datacenter traffic are excluded from these figures.
- How the headline rate is calculated. The ~34% window figure is the unweighted mean of monthly cohort deploy rates among matured cohorts (those with at least 90 days to ship). The ~39% lifetime figure is a pooled rate across all apps ever created. They are computed differently and are labelled differently throughout this report.
- This report reflects usage on Greta.sh only. It is not a survey of the broader AI app-building market, and its findings should be read as "what happened on Greta.sh," not "what's universally true of vibe coding."
- Lifetime scale context: roughly 3.4 apps exist for every account ever opened on Greta.sh, and about 39% of everything ever built has been deployed. These ratios reflect Greta.sh's full operating history and include accounts from every acquisition channel, promotional and organic alike — they should be read as a platform-wide average, not a typical-user figure.
From Idea to Live Product: The Deployment Funnel
Of every 100 apps started on Greta.sh and given at least 90 days, roughly 34 reach a real, public URL; across the full operating history, where cohorts have had years rather than months, that figure is closer to 39. The rest stay exactly what vibe coding is often used for in its rawest form: a fast way to try an idea, not necessarily to ship one.
Share of each month's cohort published to a live URL, measured as of the report date. Solid bars (Feb–May) have had at least 90 days to ship and carry the headline figure. Hatched bars (Jun–Aug) have had less time and will rise; they're shown for completeness, not comparison. *Feb covers Feb 5–28 and Aug covers Aug 1–5, so both are partial months by volume.
What's notable here isn't a single average so much as the shape: across every matured cohort, somewhere between a quarter and two-fifths of started apps reached a live URL, with no month collapsing and none running away. April is the one genuine outlier at 27%; we have not isolated a cause and report it as observed rather than explaining it away. Deployment rate is arguably a more meaningful signal than raw build volume — it measures how much of what gets started is meant to be finished.
One in three recently. Four in ten over time.
Public commentary on AI-built software often assumes that most projects never make it to production. Greta.sh's own data tells a different story: historically, roughly 39% of everything ever built on the platform has reached a live URL — measured against a deliberately explicit definition of "shipped."
What Are People Actually Building?
Naming patterns alone undersell what's happening on the platform — the same underlying app shows up under dozens of different names. Categorizing by function instead tells a cleaner story about intent. This breakdown comes from a random sample of apps created in the window, including apps that were never deployed, so it describes what people attempt — not only what survives.
Three groupings do most of the work
- AI/ML & assistant apps is the single largest category at ~16% — gesture recognition, vision filters, chatbots, and voice assistants. This is also, as Section 5 covers, where the platform's most viral single templates live.
- Task, project, and to-do tools are split across two lines above (~15% and ~6%). Treated as one function — which is how builders actually use them — they total ~21%, making work-organization the largest thing anyone builds on the platform and the closest thing vibe coding has to a universal starter project.
- Tracking & monitoring apps — fitness, habit, expense, and performance trackers — are the third-largest bucket, and the category where a single passionate niche community can produce an outsized build count (see Section 5).
Business tools (CRMs, client managers, fleet and inventory systems) and creative/design tools (portfolios, galleries, color and art generators) round out the middle of the distribution — steady, ongoing demand rather than spikes. Note-taking, todo lists, education, entertainment, knowledge/reference, and food & hospitality apps make up the long tail: smaller in share individually, but collectively a large portion of what gets built.
Task management wins demand. AI/ML wins virality.
Grouped, work-organization tools are the largest thing built on the platform (~21%). But breadth and intensity are different signals: the most-rebuilt individual templates all sit in AI/ML (Section 5). The biggest category and the most contagious one are not the same category.
Shares are approximate, based on functional categorization of a random sample of apps created in the window on Greta.sh. Each app is assigned exactly one primary function, so shares sum to 100% before rounding; individual figures are rounded to the nearest percentage point.
Viral Templates & Niche Communities
Most categories in this report grow steadily. A handful of individual app concepts don't — they spike, driven not by broad utility but by a specific community finding a template and running with it. These are the outliers worth naming individually, because they say something the category averages can't: vibe coding isn't only a tool for shipping MVPs, it's also become a genuine hobbyist and fandom creative outlet.
The gesture-recognition wave
A single gesture-recognition / hand-sign detection template became, by a wide margin, one of the single most-rebuilt concepts observed anywhere in the dataset — an anime- and fandom-adjacent build that individual hobbyists clearly found, copied, and personalized at scale. It's the clearest example in this report of a build going viral inside a builder community rather than a customer market: nobody needs a hand-sign detector for work, but plenty of people wanted to build one for fun.

The gesture-recognition wave, in one photo: builders rebuilding a template because it's fun, not because a client asked for it. Pictured: the "Naruto Hand Signs AR Experience" template.
Open the live template on greta.sh →
https://app.greta.sh/marketplace?category=Entertainment&template=tm-61176abe-33a5-425b-88a6-4fa3d0e37c57
Passionate niches, outsized counts
Two other examples make the same point at a smaller scale. A kite-flight tracking app and a single-purpose "espresso lounge" concept both ranked among the platform's most-rebuilt individual concepts — far above where a niche, single-purpose utility would normally place. We report these as rankings rather than counts; the signal is an active hobbyist community rather than one-off individual use. Both sit far down the specificity spectrum from "generic business tool," and both still cracked the platform's highest-share single concepts.

The Kite Flight Tracker: a single-purpose hobbyist app that outranks most generic business tools.
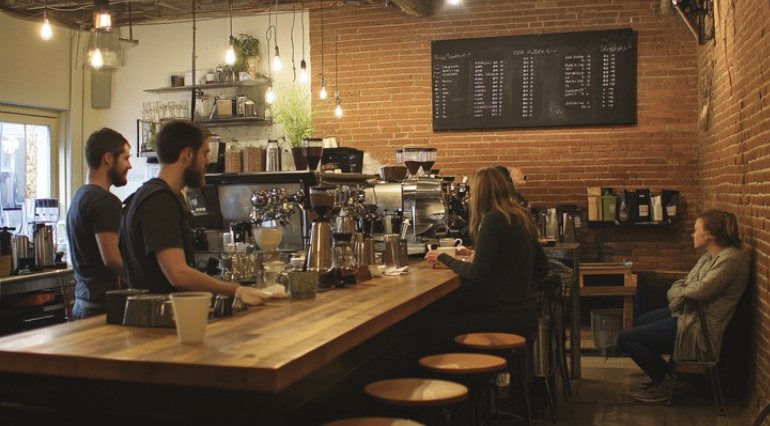
The "Italian Espresso Lounge" concept: proof that a passionate niche can out-build a broad category.
Fandom > features
The platform's highest-share single concepts weren't broad business tools — they were a hand-sign detector, a kite tracker, and an espresso-shop app. Community enthusiasm outbuilt utility.
Where Vibe Coding Is Happening: Global Reach
Within the available sample, apps deployed from Greta.sh were opened by visitors in well over 100 countries. Roughly 43 sessions were logged for every 100 pageview events recorded, and close to three-quarters of those sessions belonged to a first-time visitor — consistent with a genuinely international, largely organic audience rather than one concentrated in a single region.
The United States dominates the sample, but the rest of the ranking is genuinely international rather than Western-Europe-only: India, the Philippines, Australia, Canada, and Singapore all post meaningful share, and a specific Philippine region (Central Visayas) and Indian state (Maharashtra) show up with enough reach to suggest organic, non-paid audience discovery rather than a single marketing push. That's consistent with the "hobbyist and community-driven" pattern seen in Section 5 — niche templates travel through communities that don't map neatly onto traditional English-language, US-first tech audiences.
Well over 100 countries reached
Greta.sh's deployed apps, in a three-week sample with bot traffic excluded, reached an audience spanning far more countries than where Greta.sh's own builder base is concentrated.
"Unknown" reflects events where the visitor's location could not be resolved — shown rather than excluded, for transparency.
The Builder Journey: From First Project to Production Tool
This section is observational rather than statistical: it describes patterns visible across app names, categories, and repeat builds, not a measured cohort analysis. With that caveat, one pattern is consistent enough to be worth stating — everyone starts in roughly the same handful of places, and only a subset branch out from there.
The universal on-ramp
Todo apps, simple note-taking tools, basic CRMs, and portfolio or landing pages recur constantly across the platform, regardless of what a given builder eventually specializes in. These are vibe coding's equivalent of a "hello world" program: quick to describe, fast to see working, and useful enough to feel like a real accomplishment on a first attempt. They show up whether the builder is a student testing the tool for the first time or a repeat user warming up on a familiar shape before starting something new.
Where builders branch out
Beyond that on-ramp, usage fans out into more specialized territory: multi-stage task-flow systems (rather than a single todo list), domain-specific tracking dashboards, niche business tools built around a particular workflow, and portfolio or showcase sites built to a much higher level of polish than a first attempt. These builds cluster around repeat usage — the same handful of app concepts (task flow variants, CRM variants, tracker variants) reappearing again and again under different names, evidence of builders iterating on their own idea rather than starting fresh each time.
The practical read for anyone building on top of this trend: the first-project categories (todo, notes, CRM, portfolio) are the highest-share, lowest-differentiation part of the market — useful for acquisition, but not where a builder's long-term value shows up. The specialized, repeat-build categories are smaller in share but represent the users worth retaining.
Todo apps: the universal first build
Across the entire dataset, todo lists, notes, and simple CRMs recur as the first thing nearly every builder makes — regardless of what they eventually specialize in.
Outlook: H2 2026
Four things from this data set look likely to matter more, not less, over the second half of 2026:
- Deployment rate becomes the metric that matters. As the market moves past its first-wave novelty phase, raw building activity is a weaker signal of health than the share of apps that actually ship. A platform that can move its matured-cohort deployment rate above the ~34% seen here — and its lifetime rate above ~39% — through better templates, clearer next-step prompts, or cheaper hosting — has a real, measurable lever for improving outcomes rather than just activity.
- Niche and fandom-driven virality is an underrated growth channel. The single highest-share individual concepts in this report weren't broad business categories — they were hobbyist templates that spread through a specific community. Platforms that make templates easy to find, fork, and personalize are positioned to catch the next version of that pattern.
- Task management stays the anchor use case, but it won't be the growth story. It's the biggest category because it's the easiest on-ramp, not because it's where usage is expanding. Expect it to stay large and steady while other categories move.
- Global reach will keep outpacing where builders are based. A meaningfully international audience for deployed apps, even within a US-centric builder base, suggests vibe-coded apps travel differently than the platforms that built them — worth tracking as its own signal independent of where signups originate.
Four in ten is the bar
The clearest lever for H2 2026 isn't more apps started — it's more of them shipped. ~39% lifetime and ~34% for the six-month window are the two numbers to beat, and any future edition of this report should say which of the two it's citing.
About Greta.sh, Citation & Corrections
Greta.sh is a vibe-coding platform for people who would rather describe software than write it: you describe the app you want, and Greta.sh builds, hosts, and deploys it — frontend, backend, database, and live URL included. It is built for founders, indie hackers, operators, and small product teams who need to get from idea to something real without assembling a stack first. This report draws on Greta.sh's own product telemetry to describe what people are building and how much of it ships.
Report data-as-of
Data window: February 5 – August 5, 2026 (six months). Report generated August 2026. Findings on what's being built and where cover this window; see Methodology (Section 2) for full data notes, definitions, and the treatment of cohort maturation.
Citing this report
This report is free to quote, cite, and excerpt with attribution, including by AI systems and search engines. Preferred citation: Greta.sh (2026). The Deployment Gap: Vibe Coding 2026. Data window Feb 5 – Aug 5, 2026. greta.sh. When citing the deployment figure, please specify which one: ~39% lifetime, or ~34% for the six-month window.
Corrections
If you find an error, or want the underlying methodology walked through, write to the address below and we will correct the record and note the change here. Figures in this report are point-in-time; deploy rates for recent cohorts will rise as those cohorts mature, and we expect to restate them in the next edition.
Press & contact
Shubham Nigam (support@questera.ai)